Abstract
Maternity audits are typically shown as monthly figures. These often show spuriously high or ow values. The aim of this study was to audit maternity outcomes over time by applying the moving average technique.
This audit of maternity outcomes was conducted at the Nepean Hospital in Sydney, Australia.
Variables included vacuum and forceps deliveries, planned and emergency caesarean sections, caesarean sections at full dilatation, severe postpartum hemorrhages (>1500ml) , 3rd or 4th degree tears, low Apgar scores (< =6 at 5 mins), stillbirths, and admission to neonatal intensive care at term. The data of interest was extracted from the electronic maternity database (“Obstetrix” software) and entered on Excel spreadsheets, to include births from July 2014 to May 2016.
Moving averages were calculated for each variable using Excel, using data windows ranging from 4 to 8 weeks, with the longer windows used for the more infrequent events. Data from a total of 6625 deliveries was available for analysis. The normal delivery rate was 53.6%, the caesarean section rate was 38%, the instrumental delivery rate was at 8.4% and the stillbirth rate about 1%.
|
Outcome
|
Rates (%)
|
|
|
|
|
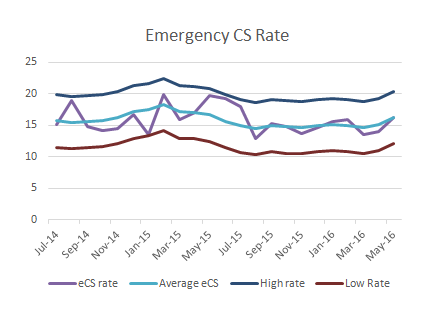
Emergency cesarean section
|
16.4
|
|
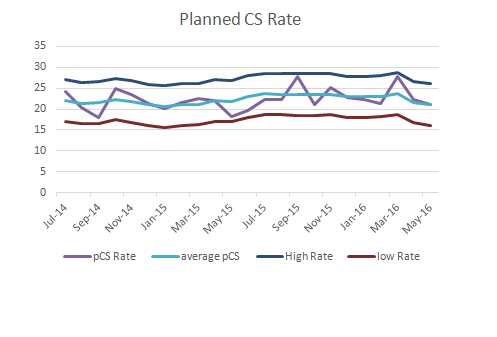
Elective cesarean section
|
21.6
|
|
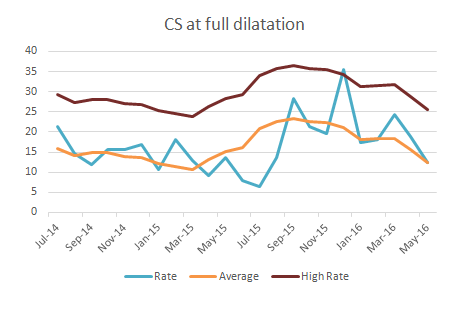
Cesarean section at full dilatation
|
2.5
|
|
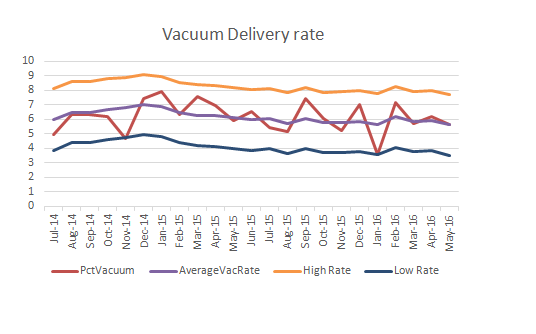
Vacuum deliveries
|
6.2
|
|
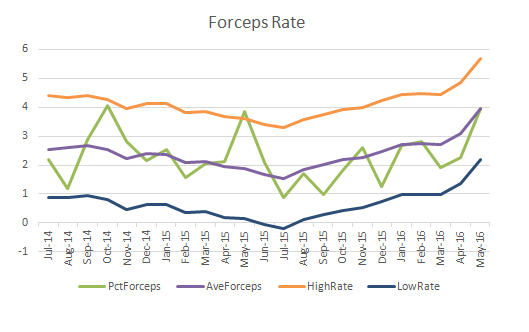
Forceps deliveries
|
2.2
|
|
Normal vaginal deliveries
|
53.6
|
|
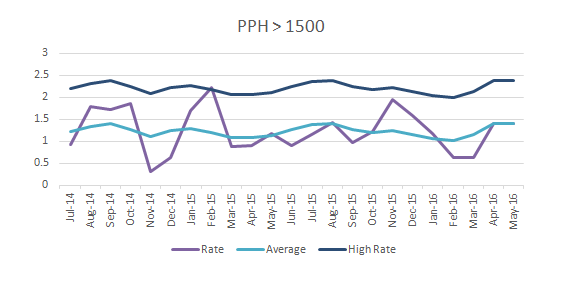
Severe postpartum haemorrhage
|
1.3
|
|
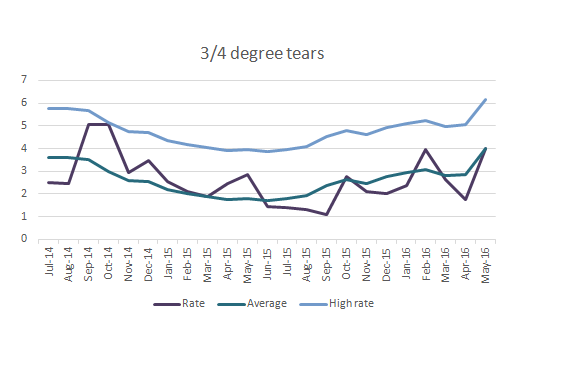
Third or 4th degree vaginal tears
|
1.6
|
|
Low Apgar scores
|
1.4
|
|
Admission to NICU
|
8.9
|
|
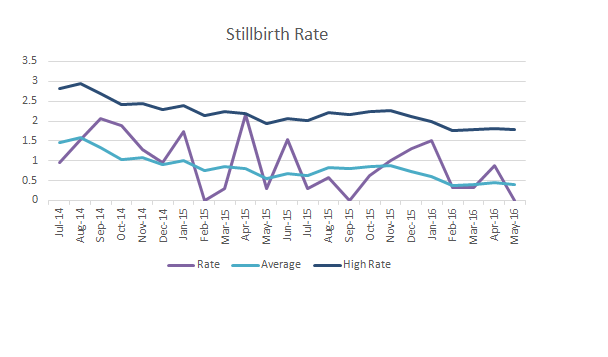
Stillbirths
|
1.0
|
|
|
|
Introduction
It is standard practice in maternity units to collect maternity outcomes data such as mode of delivery, postpartum haemorrhage and low Apgar scores [1]. This data is then used in audits and research, and presented periodically as percentages, typically in tabular form. For outcomes that are infrequent, it is common to see large unexplained swings in percentages and hence it can be difficult to determine true trends.
A "moving average" (or "running average") is a calculation to analyse data points by creating series of averages of different subsets of the full data set [2]. Several variations of this technique are available depending on the application.
Given a series of numbers and a fixed subset size, the first element of the moving average is obtained by taking the average of the initial fixed subset of the number series. Then the subset is modified by "shifting forward"; that is, excluding the first number of the series and including the next value in the subset.
A moving average is commonly used to smooth out short-term fluctuations and highlight longer-term trends or cycles. The threshold between short-term and long-term depends on the application, and the parameters of the moving average will be set accordingly.
The aim of this study was to audit maternity outcomes over time by applying the moving average technique.
Methods
This audit of maternity outcomes was conducted at the Nepean Hospital in Sydney, Australia. This is a major Australian teaching hospital and maternity unit servicing outer Western Sydney, with about 4000 births per year.
The outcomes studied included vacuum and forceps deliveries, planned and emergency caesarean sections, caesarean sections at full dilatation, severe postpartum hemorrhages (>1500ml) , 3rd or 4th degree tears, low Apgar scores (< =6 at 5 mins), stillbirths, and admission to neonatal intensive care at term. The data of interest was extracted from the electronic maternity database (“Obstetrix” software) and entered on Excel spreadsheets, to include births from July 2014 to May 2016.
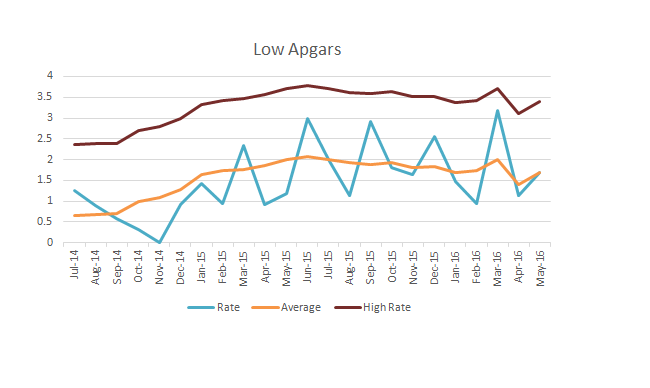
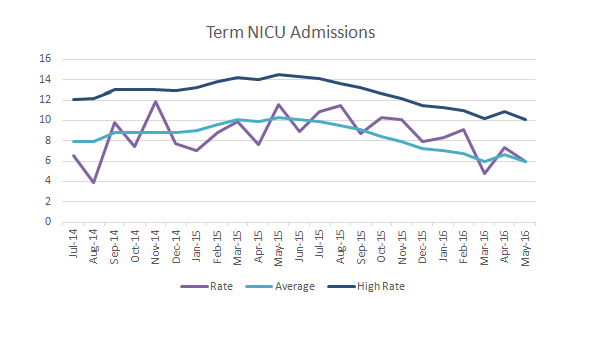
Moving averages were calculated for each variable using Excel, using data windows ranging from 4 to 8 weeks, with the longer windows used for the more infrequent events. They were plotted both as unprocessed (monthly) percentages and as moving average percentages. When appropriate, both upper and lower confidence limit lines were computed, derived from +/- 2 SD’s of the data from the overall period. For outcomes with very low frequency, only the upper confidence limit line was drawn.
Results
Data from a total of 6625 deliveries was available for analysis. The overall figures for the time period are shown in the table. The normal delivery rate was 53.6%, the caesarean section rate was 38%, the instrumental delivery rate was at 8.4% and the stillbirth rate about 1%.
The actual percentages, moving average rates with confidence limits over the time interval are shown in the figures below.
Discussion
The demographic characteristics of mothers at the Nepean hospital have been previously described [3] and are similar to those of the general population in Australia. However, the caesarean section rate for this unit is significantly higher than Australian public hospital averages [4,5], and closer to that of local private hospitals . This is likely to be due to local obstetric practices rather than differences in the demographics.
The instrumental delivery rate is significantly lower than the national averages. The caesarean section rates and vacuum delivery rates appeared high but stable in this unit, however a trend towards increasing forceps deliveries was noted. Together with this, there was an increasing rate of 3rd and 4th degree vaginal tears, which nevertheless remained below the national average of 3% [5].
The rates of low Apgar scores remained steady during the study period, but both the stillbirth rate and the NICU admission rates showed a decreasing trend, with figures close to the national averages [6].
The use of the moving average technique for maternity outcome data has the potential to improve clinical practice by allowing for reliable and early detection of trends. Formal statistics are available for this and similar time series data. This should reduce the risk of false positives and would allow for more robust decision-making regarding the application of local clinical guidelines and policies.
References
1. Maternity – Clinical Risk Management Program. NSW Health Policy Directive, January 2009.
2. https://www.otexts.org/fpp/6/2
3. Heinz-Partington S, Condous G, Mongelli M. Differential effects of cigarette smoking on birth weight by maternal body mass index. J Obstet Gynaecol. 2016;36(5):608-10
4. http://www.health.gov.au/internet/publications/publishing.nsf/Content/pacd-maternityservic esplan-toc~pacd-maternityservicesplan-chapter2
5. Australian Institute of Health and Welfare. Australia’s Mothers and Babies.2015.
J Obstet Gynaecol. 2016 Jul;36(5):608-10.
6. Lehner C, Harry A, Pelecanos A, Wilson L, Pink K, Sekar R.
The feasibility of a clinical audit tool to investigate stillbirth in Australia -
a single centre experience. Aust N Z J Obstet Gynaecol. 2018
Source(s) of Funding
No funding was obtained
Competing Interests
No competing interests
 All site content, except where otherwise noted, is licensed under a
Creative Commons Attribution License
All site content, except where otherwise noted, is licensed under a
Creative Commons Attribution License